 |
 |
- Search
| Neonatal Med > Volume 25(3); 2018 > Article |
|
Abstract
Purpose
Methods
Results
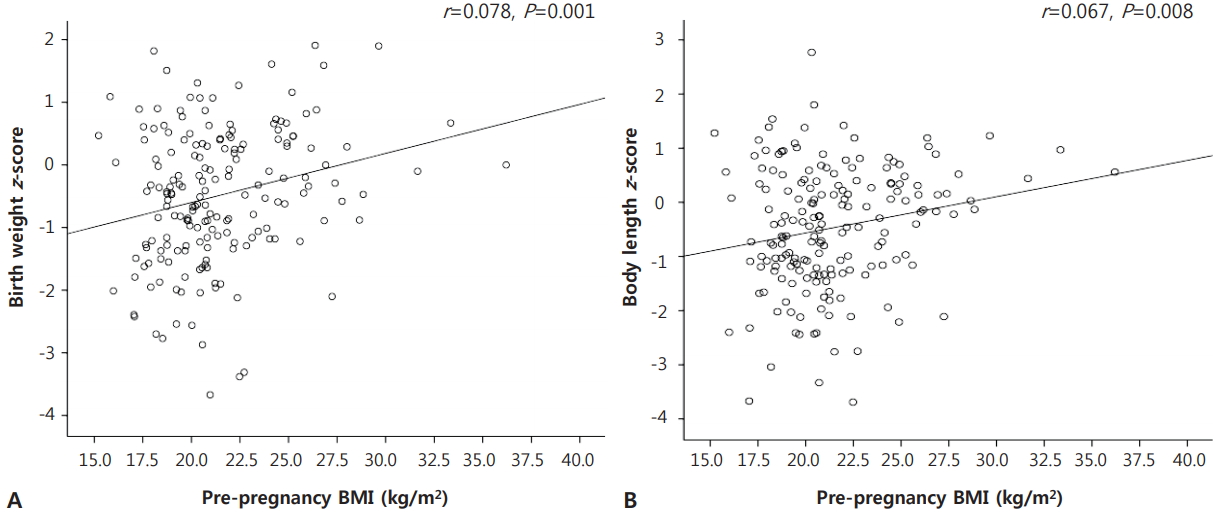
Figure┬Ā2.

Table┬Ā1.
Table┬Ā2.
| Characteristics | Pre-pregnancy BMI | |||
|---|---|---|---|---|
| Underweight (n=30) | Normal (n=106) | Overweight or obese (n=45) | P-value | |
| Male sex | 20 (66.7) | 46 (43.4) | 29 (64.4) | 0.014 |
| Gestational age (wk) | 29+6 (28+4 to 32+1) | 29+4 (28+1 to 31+3) | 28+5 (26+3 to 20+0) | 0.001 |
| ŌĆā<28 wk | 5 (16.7) | 26 (24.5) | 21 (46.7) | 0.006 |
| Birth weight (g) | 1,220 (1,025 to 1,445) | 1,155 (958 to 1,310) | 1,010 (820 to 1,295) | 0.028 |
| ŌĆā<1,000 g | 6 (20.0) | 26 (24.5) | 21 (46.7) | 0.011 |
| Birth weight z-score | -1.03 (-1.66 to 0.42) | -0.64 (-1.29 to 0.25) | -0.10 (-0.61 to 0.67) | 0.003 |
| Head circumference (cm) | 27.0 (25.8 to 28.4) | 27.0 (25.0 to 28.0) | 25.5 (23.8 to 27.5) | 0.005 |
| Head circumference z-score | -0.60 (-1.43 to 0.73) | -0.38 (-0.92 to 0.32) | 0.00 (-0.95 to 0.74) | 0.162 |
| Body length (cm) | 38.9 (37.0 to 40.3) | 37.4 (35.5 to 39.0) | 36.5 (34.0 to 39.0) | 0.015 |
| Body length z-score | -0.74 (-1.21 to 0.60) | -0.63 (-1.34 to 0.21) | 0.06 (-0.65 to 0.50) | 0.018 |
| Apgar score at 5 min <7 | 12 (40.0) | 54 (50.9) | 25 (55.6) | 0.409 |
| SGA | 12 (40.0) | 25 (23.6) | 3 (6.7) | 0.003 |
| LGA | 1 (3.3) | 3 (2.8) | 4 (8.9) | 0.241 |
| Treated PDA, no./total no. | 7/30 (23.3) | 27/105 (25.7) | 14/41 (34.1) | 0.512 |
| Sepsis, no./total no. | 8/30 (26.7) | 21/106 (19.8) | 6/44 (13.6) | 0.376 |
| Duration of respiratory support (d) | 10 (4 to 29) | 15 (6 to 39) | 22 (9 to 44) | 0.081 |
| Number of blood infusion* | 1 (1 to 2) | 2 (0 to 4) | 2 (0 to 3) | 0.872 |
| Duration of TPN infusion (d)ŌĆĀ | 23 (15 to 31) | 21 (14 to 35) | 27(16 to 38) | 0.600 |
| NEC stage >2, no./total no. | 5/30 (16.7) | 4/105 (3.8) | 3/42 (7.1) | 0.047 |
| Moderate to severe BPD, no./total no. | 3/26 (11.5) | 13/97 (13.4) | 5/37 (13.5) | 0.966 |
| IVH grade >3, no./total no. | 1/29 (3.4) | 5/103 (4.9) | 1/43 (2.3) | 0.766 |
| Cystic PVL, no./total no. | 1/29 (3.4) | 5/103 (4.9) | 3/43 (7.0) | 0.785 |
| ROP stage >3, no./total no. | 2/26 (7.7) | 2/95 (2.1) | 5/37 (13.5) | 0.035 |
| EUGR, no./total no. | 20/30 (66.7) | 72/104 (69.2) | 25/45 (55.6) | 0.270 |
| Death | 2 (6.7) | 7 (6.6) | 3 (6.7) | 1.000 |
| PMA at discharge (wk) | 38+1 (36+0 to 39+4) | 38+0 (36+4 to 39+6) | 37+5 (35+4 to 38+4) | 0.205 |
| Changes of body weight z-score during hospitalizationŌĆĪ | -1.20 (-1.98 to -0.69) | -1.18 (-2.07 to -0.71) | -1.54 (-2.05 to -0.67) | 0.849 |
| Duration of hospitalization (d) | 51 (32 to 70) | 55 (38 to 71) | 61 (46 to 73) | 0.302 |
* Data were available for 29 infants in the underweight group, 103 infants in the normal weight group, and 42 infants in the overweight or obese group;
ŌĆĀ Data were available for 28 infants in the underweight group, 98 infants in the normal weight group, and 41 infants in the overweight or obese group;
ŌĆĪ Data were available for 30 infants in the underweight group, 105 infants in the normal weight group, and 45 infants in the overweight or obese group.
Abbreviations: BMI, body mass index; SGA, small for gestational age; LGA, large for gestational age; PDA, patent ductus arteriosus; TPN, total parenteral nutrition; NEC, necrotizing enterocolitis; BPD, bronchopulmonary dysplasia; IVH, intraventricular hemorrhage; PVL, periventricular leukomalacia; ROP, retinopathy of prematurity; EUGR, extrauterine growth retardation; PMA, post-menstrual age.
Table┬Ā3.
| Pre-pregnancy BMI (kg/m2) | ||||
|---|---|---|---|---|
| B | SE | P-value | ||
| Gestational age (wk) | -0.501 | 0.218 | 0.023* | |
| Birth weight z-score | 0.212 | 0.088 | 0.017* | |
| Body length z-score | 0.224 | 0.099 | 0.026* | |
Table┬Ā4.
| Pre-pregnancy BMI | OR (95% CI) | |||
|---|---|---|---|---|
| Unadjusted model | Adjusted model 1 | Adjusted model 2 | ||
| SGA | ||||
| ŌĆāUnderweight | 2.160 (0.917-5.090) | 2.958 (1.113-7.864)* | ||
| ŌĆāNormal | Reference | Reference | ||
| Overweight or obese | 0.231 (0.066-0.811) | 0.149 (0.033-0.679)* | ||
| NECŌēźstage 2 | ||||
| ŌĆāUnderweight | 5.050 (1.263-20.189) | 11.473 (1.548-85.028)ŌĆĀ | 10.274 (0.813-129.753)ŌĆĪ | |
| ŌĆāNormal | Reference | Reference | Reference | |
| ŌĆāOverweight or obese | 1.942 (0.416-9.077) | 1.187 (0.150-9.381)ŌĆĀ | 0.217 (0.007-6.745)ŌĆĪ | |
| ROPŌēźstage 3 | ||||
| ŌĆāUnderweight | 3.875 (0.519-28.940) | 6.999 (0.608-80.549)ŌĆĀ | 6.242 (0.457-85.160)ŌĆĪ | |
| ŌĆāNormal | Reference | Reference | Reference | |
| ŌĆāOverweight or obese | 7.266 (1.343-39.309) | 9.366 (1.339-65.523)ŌĆĀ | 9.546 (1.230-74.109)ŌĆĪ | |
* Adjusted for maternal age, preeclampsia, gestational diabetes mellitus, and maternal weight gain (%);
ŌĆĀ Adjusted for maternal age, preeclampsia, gesta-tional diabetes mellitus, maternal weight gain (%), antenatal corticosteroids use, sex, gestational age, birth weight, and SGA;
REFERENCES
-
METRICS

-
- 0 Crossref
- 6,187 View
- 108 Download
- Related articles in NM
-
The Risk Factors of Periventricular Leukomalacia among Very Low Birth Weight Infants2020 May;27(2)


